Navigating through modern economic landscapes requires a detailed understanding of how earnings distribute across diverse workforce populations. The primary baseline uk average salary serves as an invaluable financial benchmark for workers evaluating their earnings, recruiters structuring fair pay offers, and professionals planning their long-term career goals. Having access to clear financial figures allows individuals to navigate workplace negotiations with confidence and gain clarity on their true position within today’s evolving employment market.
Deciphering complex labor market statistics often feels overwhelming due to varying analytical sources, definitions, and collection methods. By systematically organizing figures into dedicated categories such as age cohorts, geographic territories, and specialized industries, professionals can easily visualize where their annual compensation stands compared to broader national standards. This detailed analytical breakdown ensures you can evaluate your career trajectory accurately while making well-informed financial and employment decisions for the future.
Introduction: What is the Average UK Salary in 2026?
Determining the overall financial wellness of the national workforce begins with inspecting gross full-time earnings. Official statistics reveal that the current median uk average salary for full-time employees reaches approximately £39,039 annually. This foundational metric marks the precise middle marker of national pay, providing an accurate representation of what typical full-time staff earn before tax deductions. Understanding this core benchmark equips job seekers with realistic income expectations across various commercial sectors.
When expanding the analytical dataset to include part-time workers alongside full-time staff, the national overall median drops down to around £32,890 per year. This significant downward shift underscores why workforce experts emphasize evaluating compensation within proper working arrangements. Recognizing these foundational wage metrics allows professionals to contextualize their personal pay structures and set realistic financial goals while evaluating potential job offers in today’s dynamic job marketplace.
Median vs. Mean: Understanding the Key Difference
Interpreting official salary measurements requires a firm grasp of the mathematical distinction between median and mean analytical methods. The full-time median uk average salary of £39,039 represents the central mid-point when all working citizens are ranked from lowest to highest earnings. Economic research organizations favor this specific metric because it prevents extremely high corporate salaries or outlier low wages from distorting the broader financial picture.
Conversely, calculating the mean salary involves summing every paycheck nationwide and dividing that total by the aggregate count of employed individuals. Because ultra-high earners and corporate executives pull the statistical average upward, the mean figure climbs much higher to around £48,512 annually. Discerning between these two distinct statistical measures prevents job seekers from mistakenly evaluating their earnings against artificially inflated mean averages.
Average UK Salary by Age Group
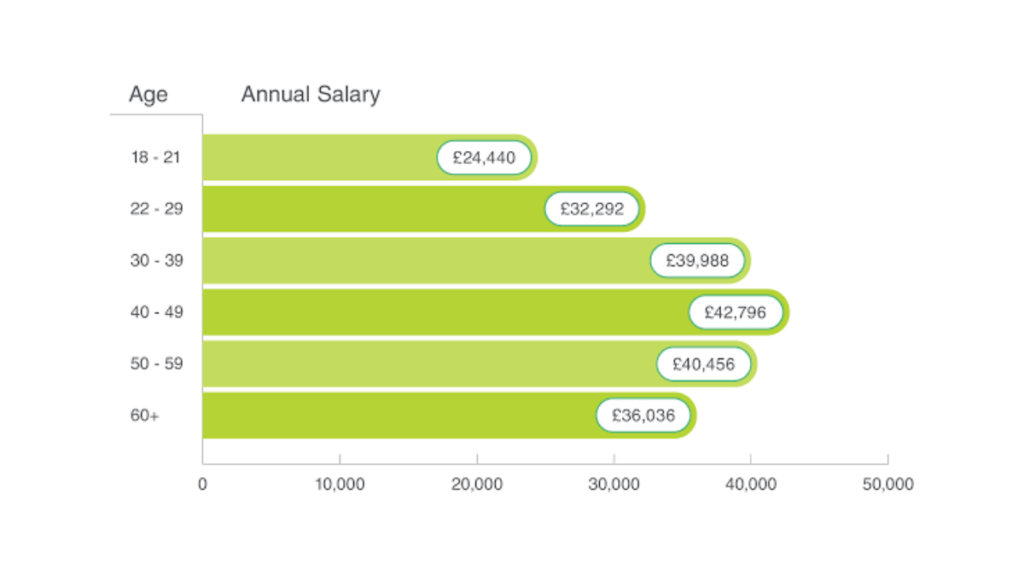
Earning potential continuously shifts across a professional lifecycle as employees accumulate specialized technical capabilities, workplace leadership, and hands-on industry experience. Consequently, the standard uk average salary alters dramatically as workers advance through various age brackets over their careers. Observing these demographic patterns highlights exact career windows where individual earning power typically reaches its absolute statistical peak.
Younger adults entering early roles typically begin their careers with modest starting wages that reflect entry-level capabilities. However, earnings grow rapidly as workers move through their twenties and thirties, gaining crucial corporate expertise and management responsibilities. Pay eventually stabilizes during the pre-retirement years as individuals transition toward flexible working arrangements, semi-retirement options, or reduced weekly working hours.
Early Career (Ages 18–29)
Entering the modern employment landscape presents both rewarding professional opportunities and distinct financial challenges for younger workers. Individuals aged 18 to 21 typically record median earnings around £22,000 annually while completing vocational apprenticeships, entry roles, or workplace training. These foundational wages reflect initial skill development while leaving substantial room for upward mobility and rapid salary expansion over short timeframes.
As professionals progress into the 22 to 29 age bracket, their annual compensation accelerates noticeably toward median figures ranging between £32,000 and £34,700. Employees within this vital decade experience some of the fastest percentage wage growth of their entire careers. Accumulating specialized certifications and stepping into supervisory roles during these formative years helps bridge the gap toward lucrative mid-career benchmarks.
Mid-Career & Peak Earning Years (Ages 30–49)
Entering the mid-career stage marks a transformative period defined by expanding corporate responsibilities and heightened financial rewards. Professionals aged 30 to 39 regularly solidify their domain expertise, driving median pay scales up toward £40,000 and £45,000. During this dynamic decade, proven track records allow ambitious workers to secure senior specialist roles, team leadership positions, and substantial salary increases.
The 40 to 49 age bracket officially represents the peak earning window for employees across the United Kingdom. Decades of accumulated expertise, strategic oversight, and executive management duties drive median full-time pay to its maximum level between £44,000 and £51,000 per year. Maximizing retirement contributions and capital growth during these high-earning years remains vital for establishing long-term personal financial independence.
Pre-Retirement & Senior Years (Ages 50+)
Moving past fifty often introduces subtle shifts regarding career focus, workplace priorities, and weekly working structures. Experienced professionals aged 50 to 59 maintain strong median earnings between £41,000 and £50,000, benefiting from extensive leadership mastery. However, rapid wage expansion typically plateaus as workers prioritize job security, mentoring roles, and better work-life balance over intense corporate advancement.
For workers aged 60 and older, median earnings gradually adjust downward toward £33,000 to £36,500 annually. This statistical decline is largely driven by individuals stepping down from high-stress executive roles into advisory positions, part-time schedules, or semi-retirement. Despite lower gross income figures, many senior employees benefit from reduced household expenses and supplementary pension distributions.
Average UK Salary by Region & City
Geographic location serves as one of the most powerful factors influencing individual pay packages and regional economic vitality. Studying the localized uk average salary uncovers substantial income disparities between major metropolitan commerce centers and rural communities. Forward-thinking employers continually adjust their regional compensation strategies to accommodate local living expenses, housing costs, and talent competition.
Metropolitan regions with dense corporate headquarters consistently offer higher gross salaries to offset elevated regional costs of living. Conversely, smaller towns and rural districts may present lower gross earnings alongside significantly more affordable housing markets. Evaluating potential career opportunities requires looking beyond headline gross numbers to calculate localized purchasing power and overall lifestyle quality.
London & The South East: Premium Compensation
London remains the undisputed economic capital of the nation, commanding remarkable wage premiums across virtually every commercial sector. Full-time median earnings in the capital reach near £50,000, while mean figures easily surpass £70,000 due to substantial financial sector bonuses. The surrounding South East region similarly benefits from close economic connectivity to London’s thriving corporate ecosystem.
These exceptional regional salaries are necessary to offset substantial local housing expenses, premium transport costs, and general living overheads. Dense concentrations of multinational headquarters, tech hubs, and investment firms spur fierce competition for elite professional talent. Consequently, employees working within the capital consistently secure compensation packages well above standard national averages.
Regional Variations: Scotland, Wales, Northern Ireland, and the English Regions
Beyond the economic pull of London, wage levels show moderate variations across the home nations and English regions. Scotland leads non-London territories with full-time median pay reaching approximately £39,719, closely mirroring national benchmarks. Meanwhile, regions such as the North East, Wales, and Northern Ireland maintain full-time median figures ranging from £34,200 to £37,100 per year.
These regional disparities reflect differing industrial strengths, public sector employment ratios, and commercial property overheads. While gross earnings appear lower outside the South East, reduced regional housing costs often yield comparable disposable income. Understanding localized pay benchmarks prevents job seekers from misjudging geographic relocation offers or remote working arrangements.
UK Average Salary by Industry and Occupation
Compensation packages vary dramatically depending on specific market sectors, commercial profitability, and specialized skill requirements. High-value industries like financial services, software engineering, pharmaceuticals, and corporate management command top-tier compensation offerings. Specialists operating within these technology-driven and capital-intensive sectors frequently earn double the national median owing to talent scarcity and intense market demand.
In contrast, consumer-facing sectors including hospitality, retail sales, social care, and leisure record lower median wages overall. These industries rely heavily on entry-level positions, minimum wage standards, and flexible part-time scheduling models. Developing specialized technical expertise or stepping into managerial operations remain the most reliable avenues for elevating individual earning power.
Full-Time vs. Part-Time Earnings and the Gender Pay Gap
Workplace structures play a decisive role in shaping national compensation statistics and individual household budgets. The stark contrast between full-time median pay (£39,039) and part-time median pay (£14,713) highlights how total weekly hours affect annual gross income. Part-time roles remain heavily concentrated within retail, healthcare support, and hospitality sectors.
Demographic distributions across part-time and full-time positions directly influence the ongoing national gender pay gap. Official data reveals that overall male earnings continue to surpass female earnings, largely due to career interruptions and caregiving obligations. Closing this persistent disparity requires expanding flexible senior working arrangements and improving access to executive leadership tracks.
What Does the Average UK Salary Look Like After Tax? (Take-Home Pay)
Gross salary figures rarely represent the actual spendable income arriving in an employee’s bank account each month. Mandatory statutory deductions—including Income Tax, National Insurance payments, and auto-enrolled pension contributions—reduce gross earnings down to net income. Accurately estimating monthly net pay is essential for constructing realistic personal budgets and managing household bills.
For a professional earning the standard full-time uk average salary of £39,039, statutory taxes remove roughly £7,412 annually. This leaves a net take-home pay of approximately £31,628 per year, translating to around £2,635 each month. Factors such as student loan repayments or voluntary pension top-ups will further adjust these final net numbers.
How to Benchmark Your Salary and Negotiate Higher Pay
Evaluating your current financial standing requires comparing your earnings against objective, verified market data sources. Utilizing official statistical databases, industry salary guides, and digital benchmarking tools helps workers determine if their pay aligns with national benchmarks. Factoring in geographic location, remote work perks, and specific job duties ensures a fair comparison.
Equipped with credible salary data, employees can enter performance reviews and pay negotiations with supreme confidence. Presenting documented workplace achievements alongside current regional benchmarks builds a compelling business case for a salary review. Pursuing continuous professional development remains the most powerful strategy for securing above-average compensation over time.
Conclusion
Analyzing national compensation trends proves that the uk average salary represents much more than a single static figure. While the £39,039 full-time median serves as an insightful baseline, individual earning potential remains deeply tied to age, location, and industry sector. Evaluating the complete context around salary figures ensures you gain an accurate understanding of your true earning power.
Ultimately, remaining informed about evolving pay trends empowers professionals to make strategic career choices and negotiate competitive compensation. Whether you are entering the workforce, planning a regional move, or aiming for executive management, referencing accurate benchmarks ensures you remain well-positioned for financial success in today’s dynamic economy.
Frequently Asked Questions (FAQs)
What is the current average full-time UK salary in 2026?
According to official statistical metrics, the median full-time gross annual salary in the UK stands at £39,039. This figure represents the precise midpoint earner among all full-time working professionals nationwide.
Is £40,000 a good salary in the UK?
Earning £40,000 per year places you slightly above the national full-time median, offering comfortable living standards in most UK regions. However, in high-cost areas like London, elevated housing and living expenses can make this income feel tighter.
What is the difference between median and mean salary?
The median represents the exact middle earner, preventing ultra-high income outliers from skewing the overall data. The mean totals all earnings together and divides by total workers, producing a higher figure (£48,512) due to top earners.
What salary puts you in the top 10% of UK earners?
Securing a gross annual income exceeding £70,000 to £75,000 places an individual within the top 10% of national earners. In high-cost areas like London, entering the top 10% typically requires annual earnings above £76,900.
How much is £39,039 after tax in the UK?
On a standard tax code without student loan deductions, a gross salary of £39,039 yields approximately £31,628 in annual take-home pay. This calculates to an estimated monthly net income of £2,635 after Income Tax and National Insurance.
Also Read: Zego Car Insurance